Note
Go to the end to download the full example code.
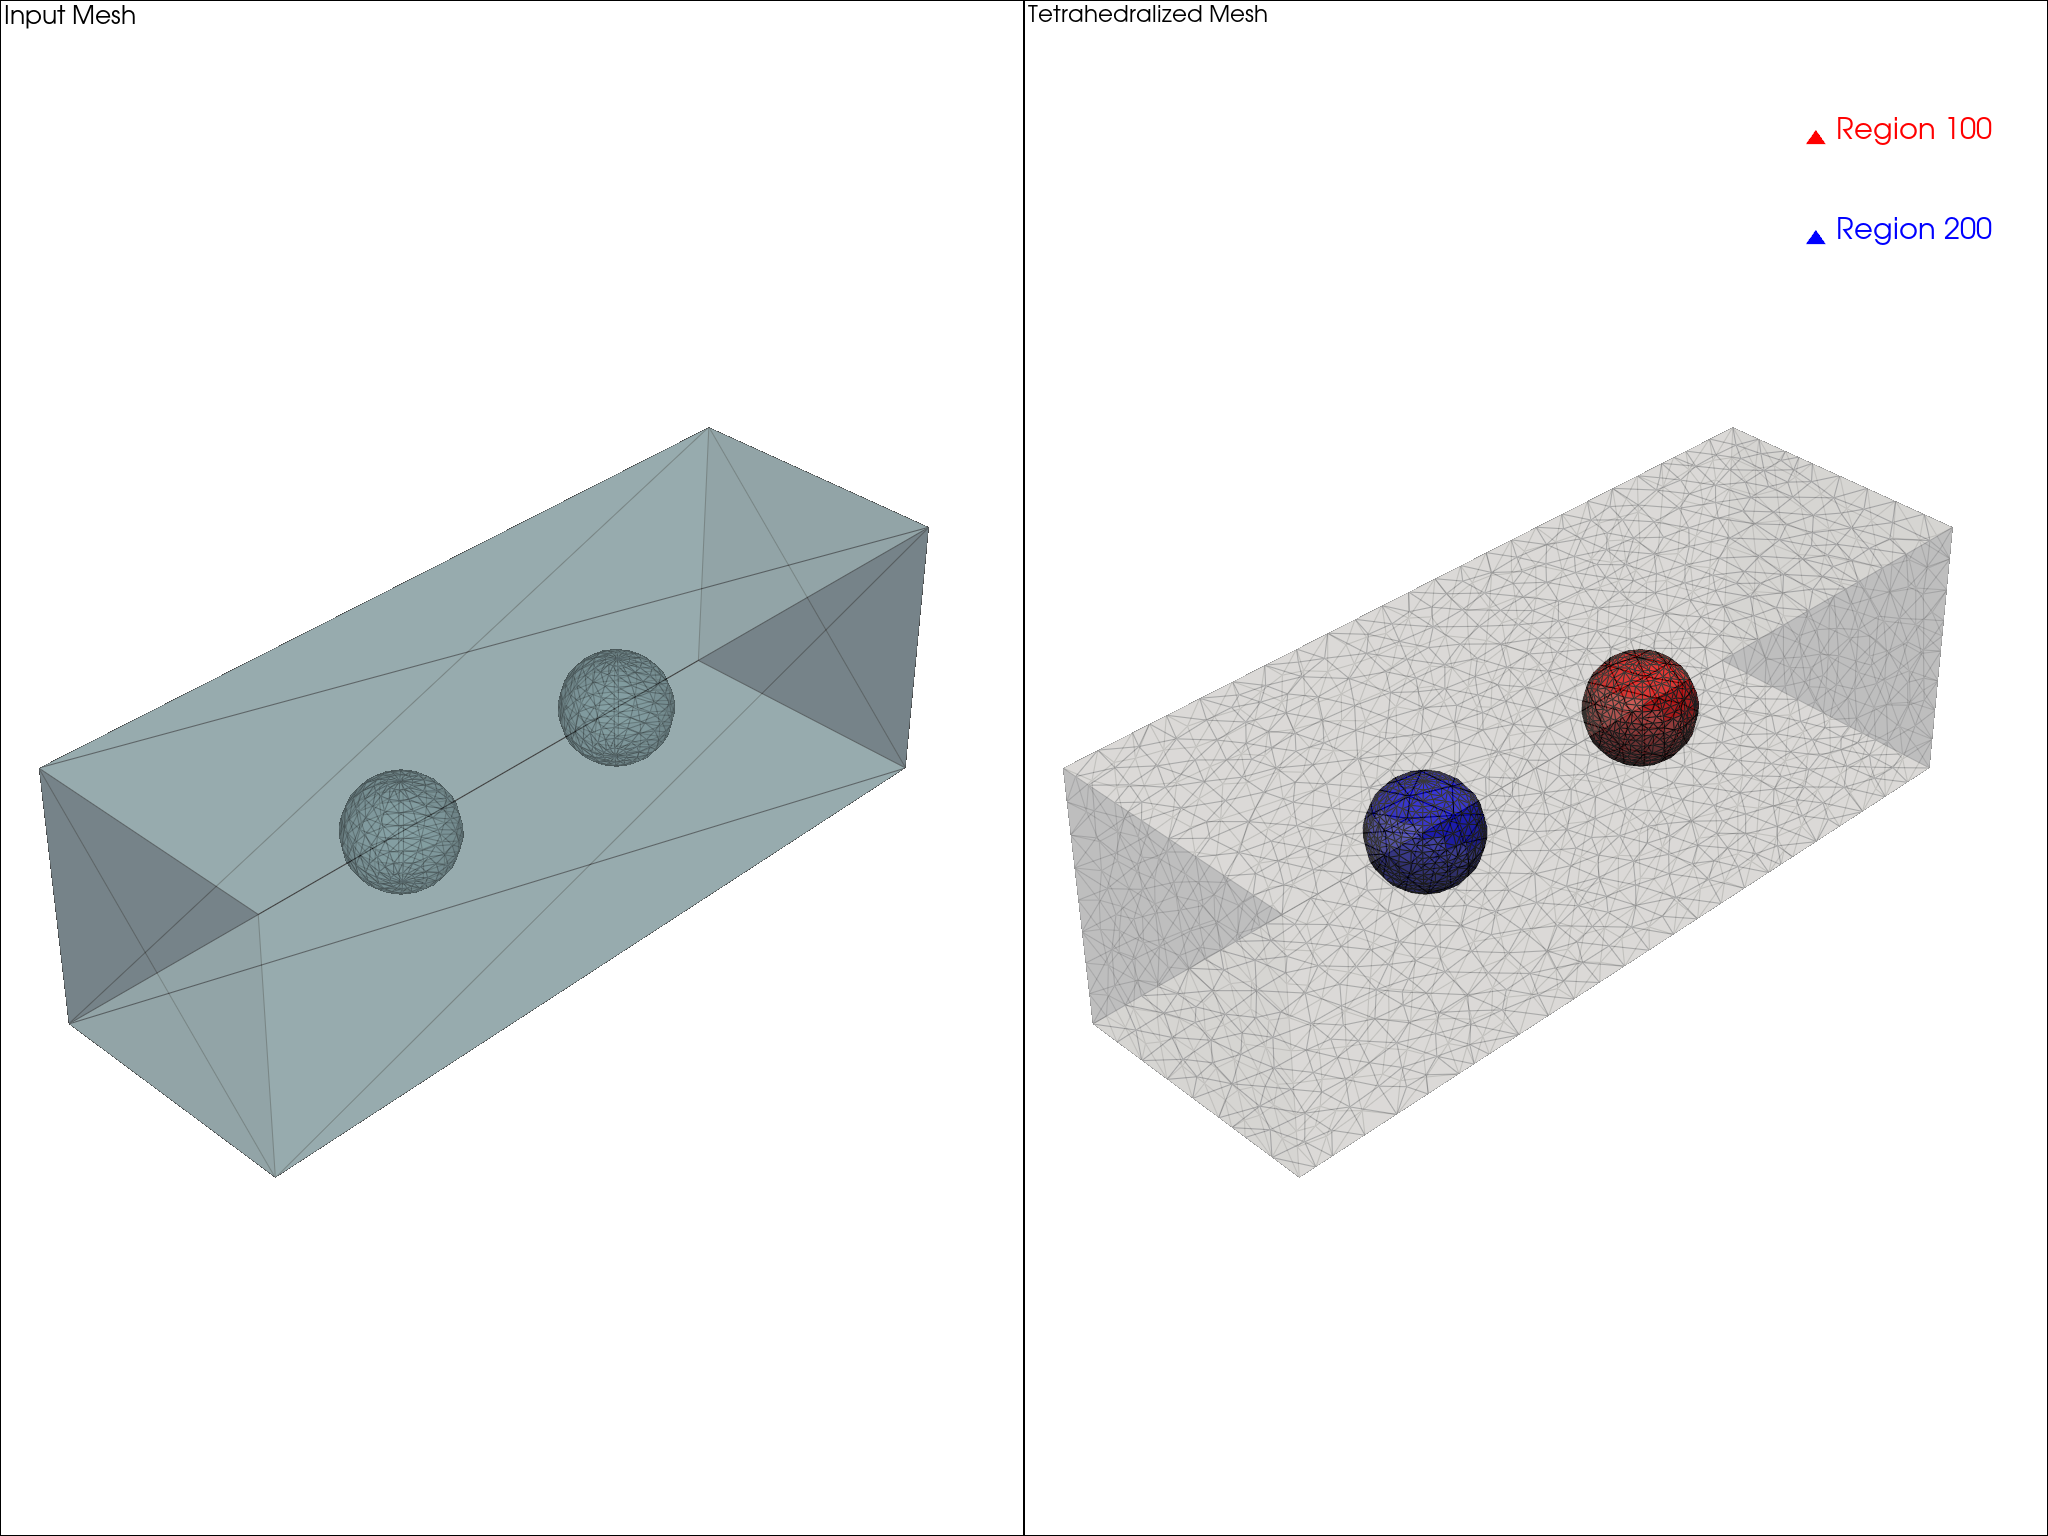
Regions#
Example of using TetGen to create a tetrahedral mesh with regions.
import numpy as np
import pyvista as pv
import tetgen

# we create a box of air with two spheres inside it
r = 0.1  # 100mm, radius of the spheres
L = 0.5  # 500mm, distance of centers
# this would give a capacitance of around 6.99pF between the two spheres

# create geometries
airbox = pv.Cube(center=[0, 0, 0], x_length=3 * L, y_length=L, z_length=L).triangulate()
sphere1 = pv.Sphere(theta_resolution=16, phi_resolution=16, center=[-L / 2, 0, 0], radius=r)
sphere2 = pv.Sphere(theta_resolution=16, phi_resolution=16, center=[L / 2, 0, 0], radius=r)

# merge the geometries
mesh = pv.merge([sphere1, sphere2, airbox])

# create a plotter
plotter = pv.Plotter(shape=(1, 2))

# plot the input mesh
plotter.add_mesh(mesh, show_edges=True, opacity=0.5, label="Input Mesh")
plotter.add_text("Input Mesh", font_size=10)

# create a subplot for the tetrahedralized mesh
plotter.subplot(0, 1)
plotter.add_text("Tetrahedralized Mesh", font_size=10)

# tetrahedralize the mesh using TetGen
tgen = tetgen.TetGen(mesh)

# add regions to the TetGen object
V_sphere = 4 / 3 * np.pi * r**3
tgen.add_region(100, [-L / 2, 0, 0], V_sphere / 5000)  # sphere 1
tgen.add_region(200, [L / 2, 0, 0], V_sphere / 5000)  # sphere 2
tgen.add_region(300, [L * 1.5, 0, 0], V_sphere / 100)  # airbox

# tetrahedralize the mesh with specified switches
nodes, elem, attrib, _ = tgen.tetrahedralize(switches="pzq1.4Aa")

grid = tgen.grid

# retrieve the region IDs from the attributes
regions = np.unique(attrib[:, 0])

# plot regions with different colors and opacities
for reg_id in regions:
    name = f"Region {reg_id}"
    reg_mask = attrib[:, 0] == reg_id
    subgrid = grid.extract_cells(reg_mask)

    if reg_id == 100:
        color = "red"
    elif reg_id == 200:
        color = "blue"
    else:
        color = "white"

    if reg_id < 300:
        opacity = 1.0
    else:
        opacity = 0.25

    plotter.add_mesh(subgrid, show_edges=True, color=color, opacity=opacity, label=name)


plotter.add_legend()
plotter.link_views()

# finally show the results
plotter.show()
Total running time of the script: (0 minutes 1.188 seconds)